We are happy to present the quarterly instalment of our mid-market M&A overview. The analysis focuses on the current quarter intending to provide you with a brief overview of recent mid-market M&A activity.
Overview
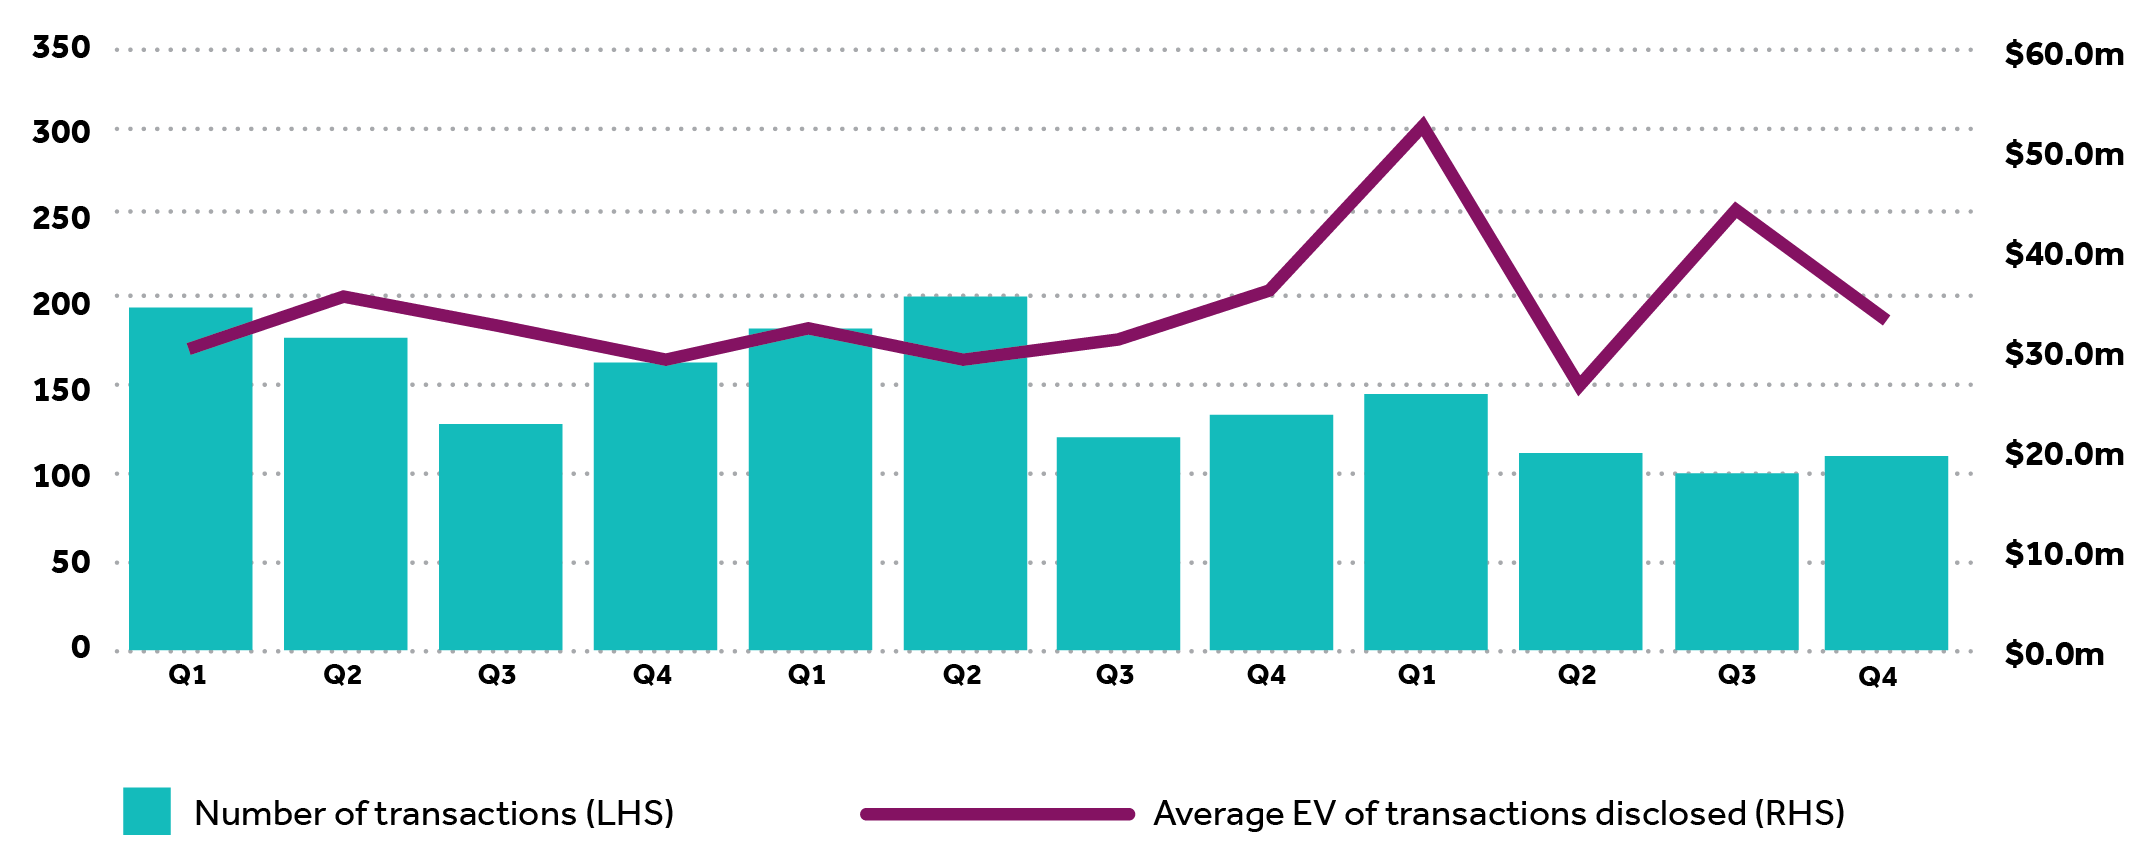
The average deal size decreased from $41.9 million in Q3 FY2024 to $31.5 million in Q4 FY2024, a decrease of 24.8%. Over the last 12 months, the average deal size increased from $30.5 million to $37.2 million, an increase of 21.9% from the average deal size for the prior 12 months.
Number of transactions and disclosed average transaction value by quarter
Sector
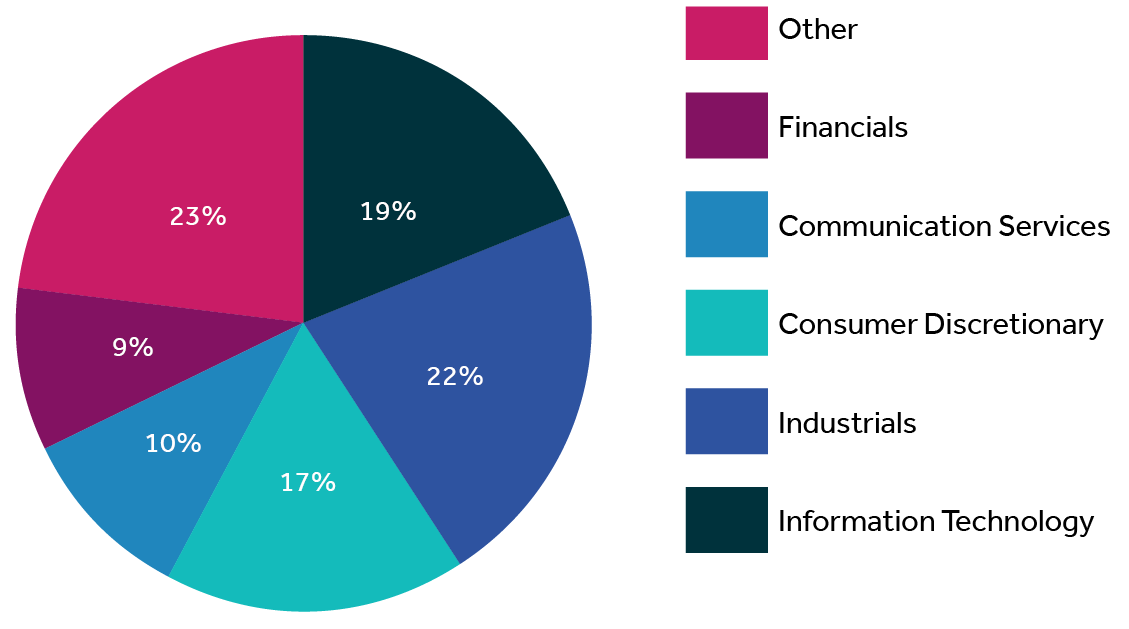
Industrials (22%), information technology (19%) and consumer discretionary (17%) were the most active sectors during the quarter, followed by communication services (10%) and financials (9%). These top five sectors represented 77% of all completed transactions in the quarter.
M&A activity in the industrials sector increased from Q3 FY2024, from 21 transactions to 23 in this quarter. The information technology sector saw a decrease in M&A activity this quarter despite being the most active sector in the prior quarter, with the number of transactions decreasing from 28 last quarter to 20 in Q4 FY2024.
Top sector activity and number of transactions
Geography
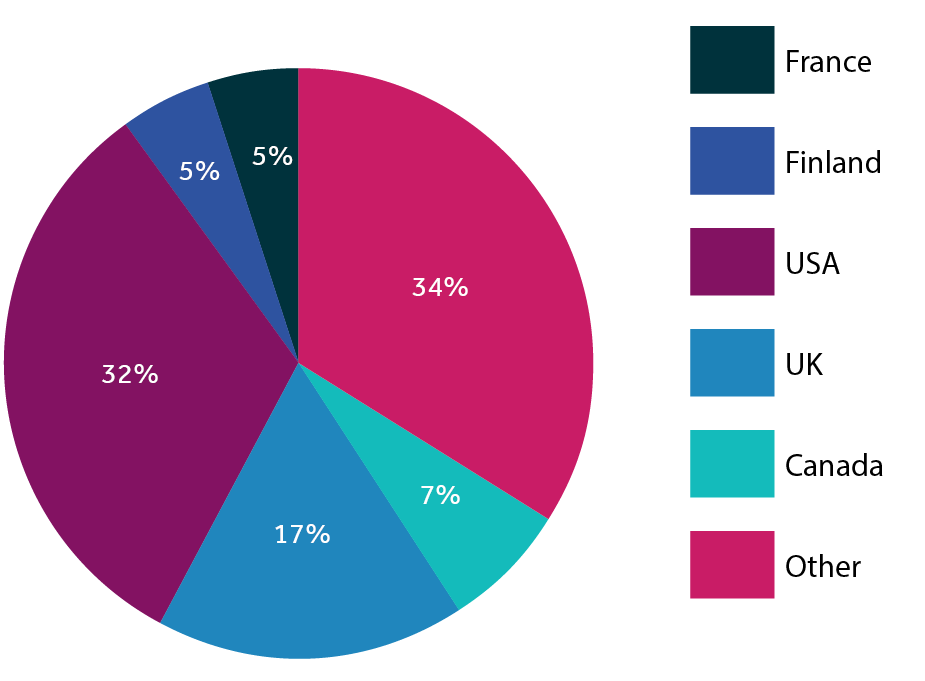
For transactions where a buyer was disclosed, overseas acquirers represented 38% of total transactions. The United States was the largest acquirer of Australian companies, representing 32% of overseas buyers in the quarter. The United Kingdom also actively acquired Australian companies, representing 17% of the total transactions.
The below graph represents the country split of the overseas transactions throughout the quarter, excluding Australian acquirers.
Overseas transactions
EBITDA multiples
The EBITDA multiples of the Nexia MM Index (see below regarding methodology and limitations) has been compared to relative ASX indices in the graph.
The Nexia MM Index compared to relative ASX listed companies
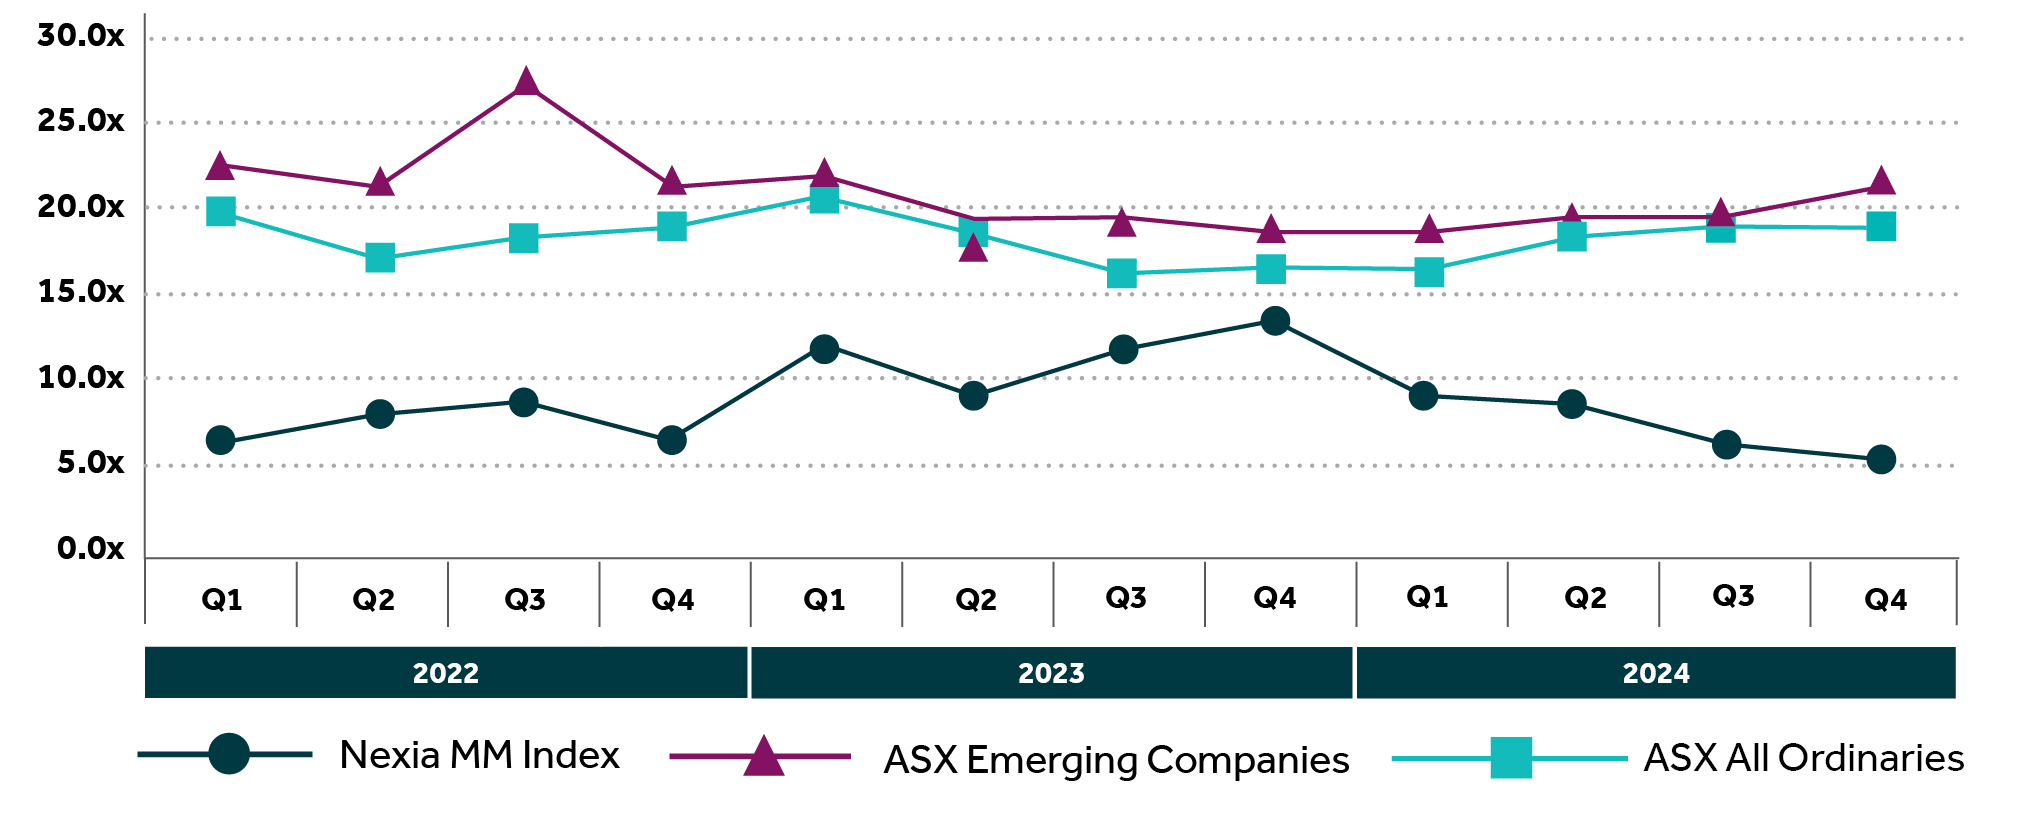
The ASX Emerging Companies index increased by 9% on the prior quarter’s figures, while the ASX All Ordinaries index decreased by 1% from the prior quarter. The Nexia MM decreased by 11% in the current quarter.
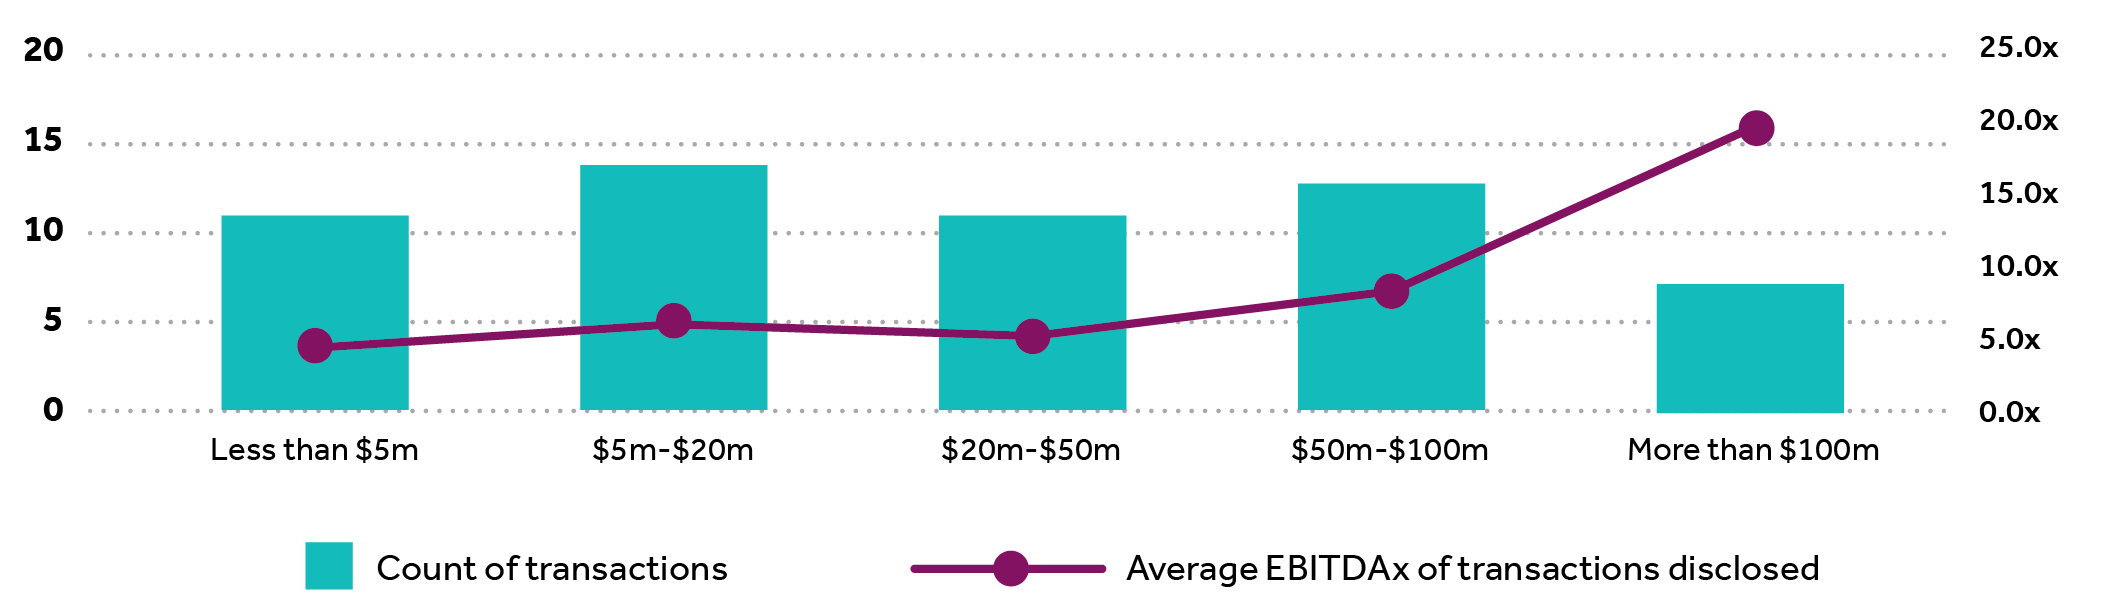
One transaction can have a significant impact on the Nexia MM Index. To provide more insight into the Nexia MM Index, we have highlighted the enterprise value and capitalisation multiple of some of the transactions.
Although the same limitations apply to this analysis as the overall index, the study bears the relationship between multiples and size, whereby companies with lower enterprise values receive lower multiples.
Number of transactions and disclosed EBITDA multiple average value by enterprise value category
M&A Transaction Announcements
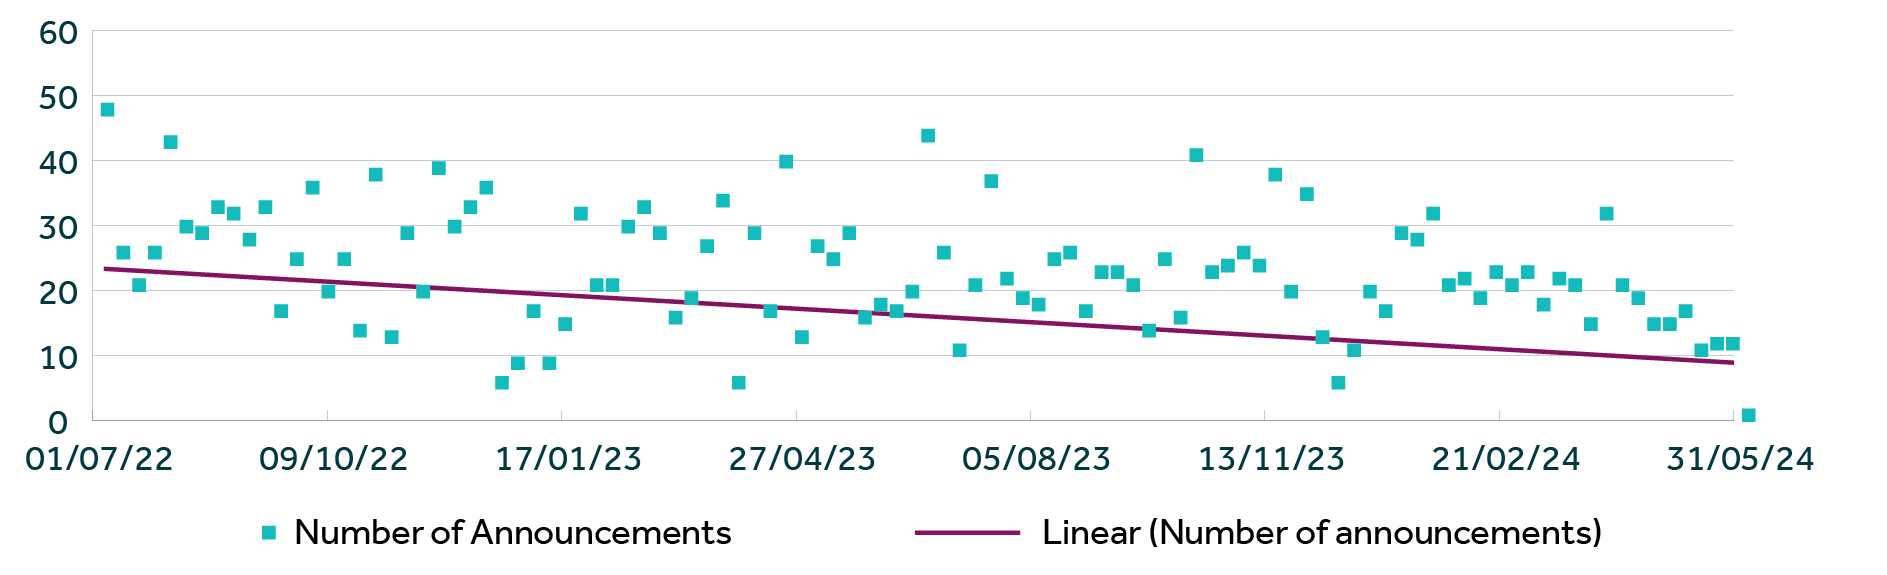
The below graph highlights the number of M&A transaction announcements per week over the last 24 months where Australian companies have been the target, regardless of size and is an indicator of future M&A activity. There has been a steady decline in activity over the last 2 years reflecting current economic conditions.
Number of transaction announcements per week in the last 24 months
Methodology
The analysis was prepared based on data sourced from S&P Capital IQ at the end of each quarter. Our data set has not been updated for transactions that may be added to S&P Capital IQ retrospectively as data becomes available. The data analysed, excluding analysis on M&A transaction announcements, is for completed transactions with a primary geographic location in Australia and an implied enterprise value of less than $200 million from 1 July 2021 to 30 June 2024. Transactions, where no value was disclosed are included in the volume data with the implicit assumption that these would relate to smaller transactions and therefore meet the criteria.
Overall, 1,761 transactions are included within the data analysed. Transaction values were disclosed for 682 (39%) of these transactions with an aggregated transaction value of $25.18 billion. 56 of these transactions (3%) had sufficient data disclosed to calculate the EBITDA multiples.
In respect of our methodology, we note that this is a simple analysis to give an overview of the market and potential movements. It should in no way be seen as a substitute for a rigorous review of any potential opportunity that you may be considering, and you should seek appropriate professional advice for your circumstances.
We note that the source data is limited by the amount of information that is made public and captured in the S&P Capital IQ database. The calculations we have performed due to the limited number of data points in respect of EBITDA multiples, can be heavily influenced by a single transaction which reflects that transaction’s particular circumstances rather than a reflection of the market as a whole.
Analysis of all transactions, including sector and buyer location is based on S&P Capital IQ classifications.
About the Nexia MM Index
The Nexia mid-market EBITDA multiple (Nexia MM Index) analysis is a simple analysis of EBITDA for acquisitions of unlisted mid-market companies where the data is reported. It is indicative of a trend in the overall market rather than implying the multiple that should be considered for a particular company. The Nexia MM is limited by several factors, including that there are a small number of transactions in Australia where the data is available. As a result, the average EBITDA multiple can be significantly influenced by individual transactions where the specific characteristics of the transaction may have resulted in a higher or lower multiple than would otherwise be achieved. To minimise the impact, we have shown a rolling annual EBITDA multiple for disclosed transactions above.
Considering the data against the listed company comparative, the Nexia MM is based on acquisitions and therefore implicitly reflects a control premium whereas the multiple for the listed companies reflects a portfolio interest.
The range in the identified EBITDA multiples is significant at 0.2x to 50.3x for FY2022, 1.1x to 30.5x for FY2023 and 1.8x to 17.7x for FY2024.